An endpoint reports an average response time of 45ms. Support has three tickets this week about the page hanging. Both facts are true, and the average is the reason nobody found the problem.
Latency is not a number, it is a distribution, and the interesting part of that distribution is nowhere near the middle. The mean is pulled around by outliers while hiding them, which is the worst combination available: high enough to look bad when things are fine, low enough to look fine when things are bad.
What a percentile actually claims
p99 = 800ms means: one request in a hundred took longer than 800ms. That is all. It is not "the worst case", it is not "99% of users are happy", and it is not a number you can add to another number.
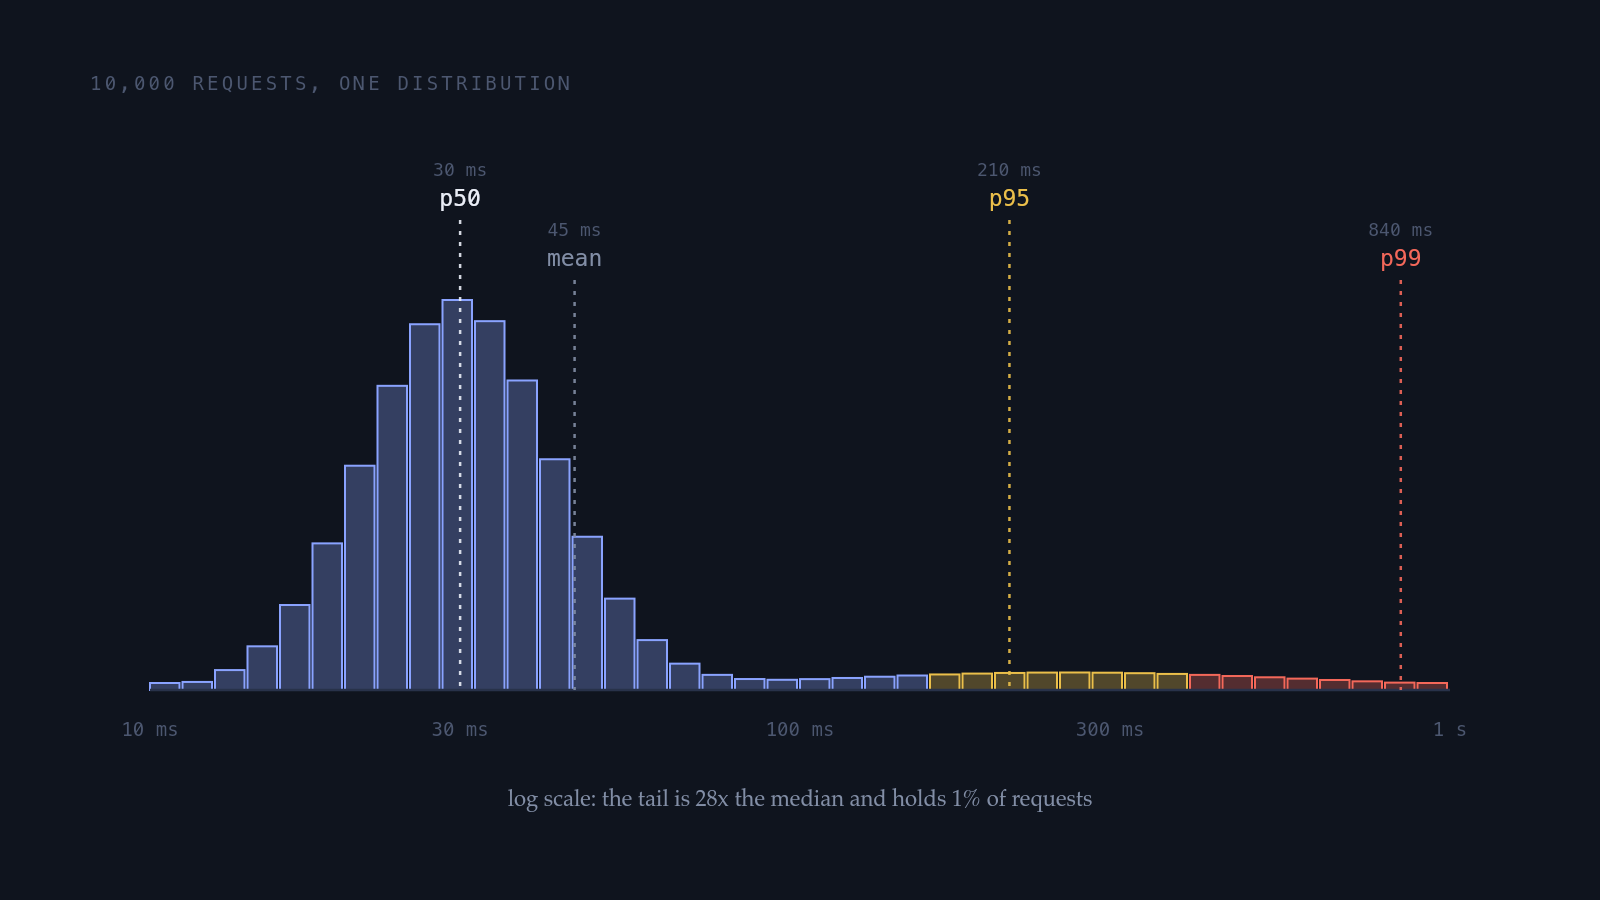
The gap between p50 and p99 is more informative than either number. A p50 of 30ms with a p99 of 60ms is a system doing the same work every time. A p50 of 30ms with a p99 of 840ms is a system that has two behaviors, and the second one is usually a cache miss, a lock, a garbage collection pause, a cold connection, or a retry.
That framing matters because it changes what you do. A uniformly slow system needs optimization. A system with a fat tail needs you to find the second behavior, and optimizing the fast path will not move p99 at all.
Per user, not per request
The percentile everyone quotes is per request. Users do not issue one request.
A page that makes 20 API calls, each with a p99 of 800ms, has a 1 minus 0.99 to the power of 20 chance of containing at least one slow call. That is 18%: nearly one load in five.
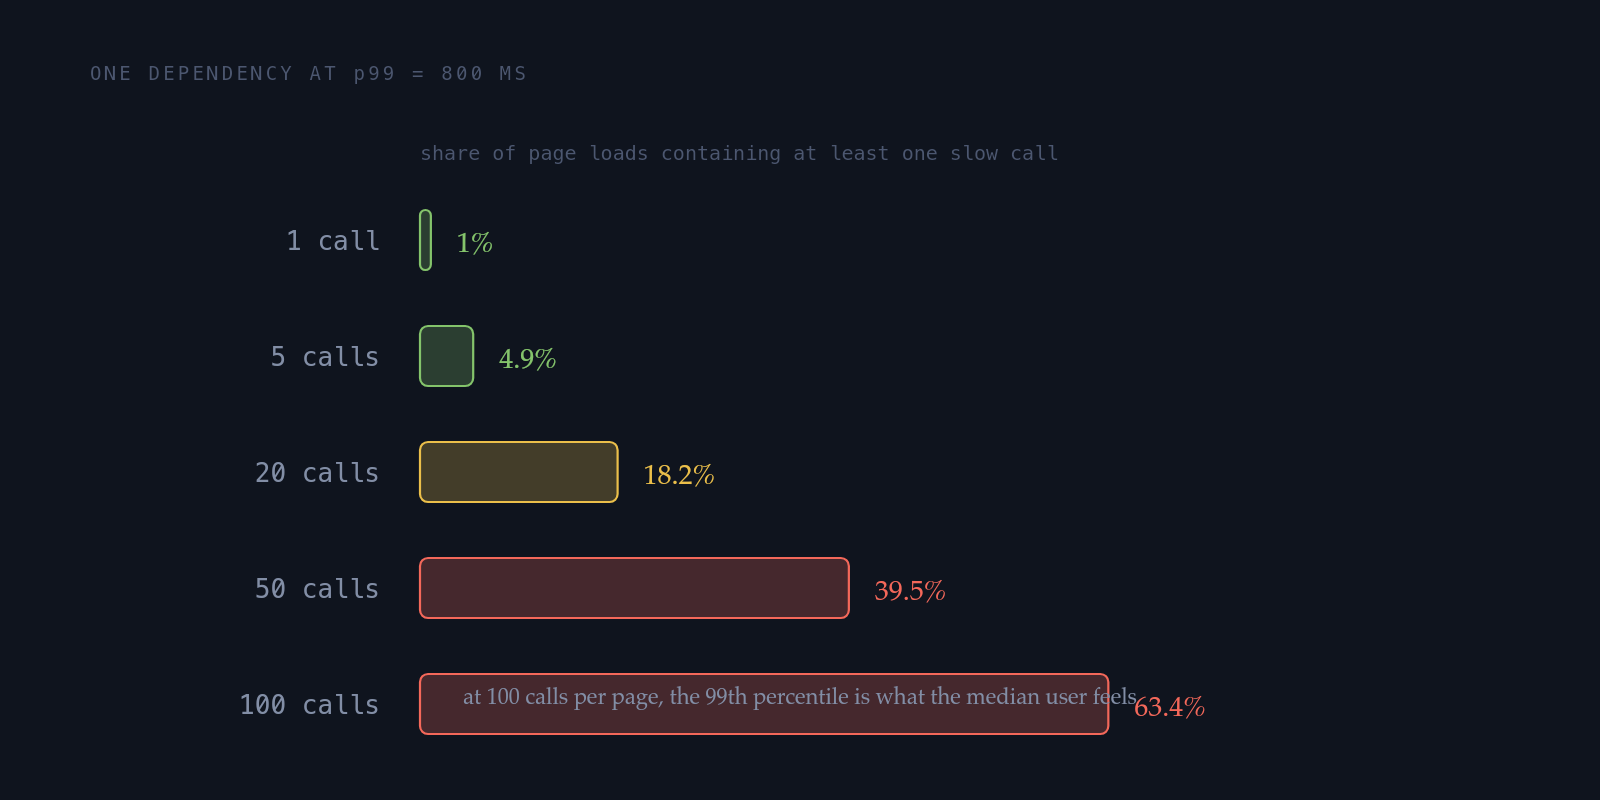
This is the core result from Dean and Barroso's The Tail at Scale, and it has a blunt design consequence: in a fan-out system, the tail latency of your dependencies becomes the typical latency of your service. Reducing the number of calls per request is often a bigger win than making each call faster.
Three mitigations, in the order they are usually worth trying:
- Cut the fan-out. Batch the twenty calls into one, or denormalize so the data arrives together. Fewer samples of the tail is the only fix that scales.
- Hedge the slow ones. Send a duplicate request to a second replica after the p95 elapses, take the first answer. This costs a few percent extra load and cuts the visible tail substantially.
- Return partial results. If a widget's data is late, render the page without it. This is a product decision more than an engineering one, which is why graceful degradation is worth agreeing on before the incident.
Two mistakes that make dashboards lie
Averaging percentiles. Ten instances each reporting a p99 of 100ms do not give you a fleet p99 of 100ms, and the mean of their p99s means nothing at all. Percentiles are not additive across dimensions. Correct aggregation needs the underlying distribution, which is why Prometheus histograms store bucket counts and compute quantiles at query time; the histogram documentation is explicit that averaging quantiles is invalid.
Measuring only what got through. If your load generator waits for a response before sending the next request, it stops generating load exactly when the system slows down, so the worst latency never gets recorded. Gil Tene named this coordinated omission in How NOT to Measure Latency, and it is why a benchmark can report a healthy p99 for a system that was stalled for two seconds. The same distortion applies to server-side timing that starts after a request leaves the queue: the time spent waiting to be handled is exactly the time the user felt.
Which percentile to hold yourself to
Higher is not automatically better. Each step out into the tail is noisier, more expensive to defend, and more likely to be dominated by things you do not control.
Which percentile belongs in the target?
- p50Capacity and costwhat the system does normally; useful for sizing, useless for user experience
- p95 or p99The user-facing targethigh enough to catch the second behavior, stable enough to hold
- p999Only for high fan-out or infraat 100 calls per request the 99.9th percentile is what the page feels; expect noise
- maxAlerting, never a targetone GC pause and one timeout define it; it says nothing about the system
For most services, p99 as the target and p50 for capacity planning is the right pair. Track both: p50 moving without p99 means the whole system got slower, and p99 moving without p50 means a specific failure mode woke up.
A percentile only becomes an engineering constraint once someone commits to a number and a consequence for missing it. That commitment is an SLO, and it is the next lesson.
Key takeaways
- Latency is a distribution. The mean hides the tail while being distorted by it, which makes it the worst single summary available.
- p99 = 800ms means one request in a hundred was slower than 800ms. Nothing more.
- The p50-to-p99 gap tells you whether you have one behavior or two. A fat tail means find the second behavior, not optimize the first.
- Fan-out amplifies the tail: 20 calls at p99 means 18% of pages contain a slow call. Cutting call count beats speeding up calls.
- Never average percentiles across instances, and never trust a benchmark that stops sending load when the system stalls.
- Target p99 for user experience, p50 for capacity, and keep max for alerts only.
Checkpoint · lesson 3 of 6
You can now:
- Read a latency distribution instead of a mean
- Compute how tail latency amplifies across a fan-out
- Avoid the two statistical mistakes that make dashboards lie