The previous lesson turned a product description into a volume of work. This one turns volume into time, because every design argument eventually reduces to the same question: how long does this operation take, and what else could you have done instead?
The famous version of this list is Jeff Dean's, circulated for two decades and reprinted in Peter Norvig's Teach Yourself Programming in Ten Years. The absolute figures have moved since: SSDs got faster, memory got cheaper, networks got better. The ratios have barely moved at all, and the ratios are the part you use.
The ladder
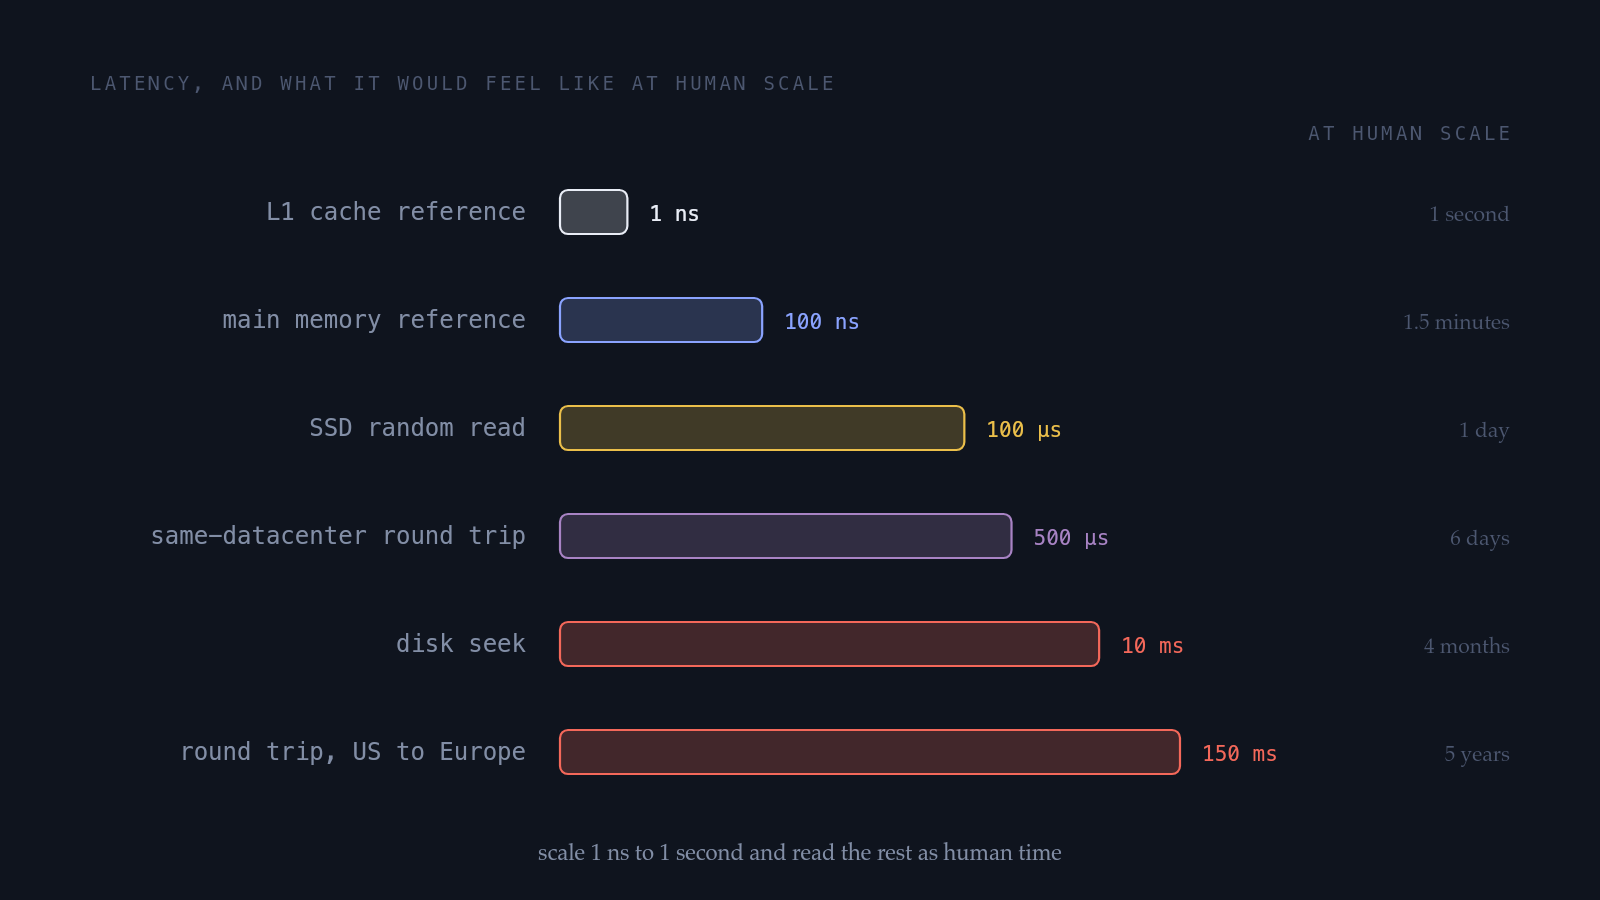
| Operation | Time | In human terms |
|---|---|---|
| L1 cache reference | ~1 ns | 1 second |
| Main memory reference | ~100 ns | 1.5 minutes |
| Read 1 MB sequentially from memory | ~10 µs | 3 hours |
| SSD random read | ~100 µs | 1 day |
| Round trip within a datacenter | ~500 µs | 6 days |
| Read 1 MB sequentially from SSD | ~1 ms | 2 weeks |
| Disk seek (spinning) | ~10 ms | 4 months |
| Round trip, one coast to the other | ~70 ms | 2 years |
| Round trip, US to Europe | ~150 ms | 5 years |
The right-hand column is the trick that makes the ladder stick: scale one nanosecond up to one second and read the rest as human durations. A memory access is a minute and a half. A cross-continent request is two years. When someone proposes a design that makes four sequential cross-region calls, they are proposing eight years of waiting, and the human scale makes that obvious in a way "280ms" does not.
Two comparisons that decide arguments
You almost never need the whole ladder. You need two comparisons.
A network hop versus a local read. A same-datacenter round trip is roughly 500µs against 100ns for memory, so one call to a service that reads one row costs about 5,000 memory accesses, nearly all of it network rather than work. That is why N+1 queries are fatal: a hundred round trips to do what one could have batched.
A cache hit versus a cross-region call. Microseconds against 70 to 150ms, a factor of a thousand. That ratio is why read-heavy systems get a cache before a bigger database, and why one misplaced cross-region dependency dominates an otherwise local request.
Sequential beats random, at every layer
The ladder has a second axis. At every level of storage, reading data that sits next to other data is dramatically cheaper than jumping around.
Sequential access
- Memory: prefetchers see the pattern and stay ahead of you
- SSD: large reads amortize the per-operation overhead
- Disk: no seek, so throughput is 100x random
- Database: one index range scan, one set of pages
Random access
- Memory: a cache miss per access, so 100ns each
- SSD: per-operation cost dominates, IOPS becomes the limit
- Disk: a seek per read, roughly 10ms each
- Database: index lookup plus a heap fetch per row
This is why an array of structs beats a linked list of pointers, why a covering index beats an index plus heap fetches, and why a batched write of 5,000 rows beats 5,000 writes. Same total bytes, different access pattern, order-of-magnitude different time. It is also why random UUID primary keys cost more than they look: they convert sequential inserts into random ones.
The numbers that changed, and the ones that did not
Being honest about which figures age matters, because quoting a 2010 number as current is a credibility problem in a design review.
Moved a lot: spinning disks left the serving path, so the 10ms seek is now a cold-storage story, and NVMe random reads are closer to 20 to 100µs.
Barely moved: memory latency has been flat near 100ns for fifteen years, same-datacenter round trips are still hundreds of microseconds (kernel, driver and switch hops, not link speed), and cross-region latency is set by geography.
That last group is the useful one. A design whose cost is dominated by memory latency, network round trips, or distance will not be rescued by newer hardware. A design whose cost is disk throughput often will.
Where these numbers enter a design
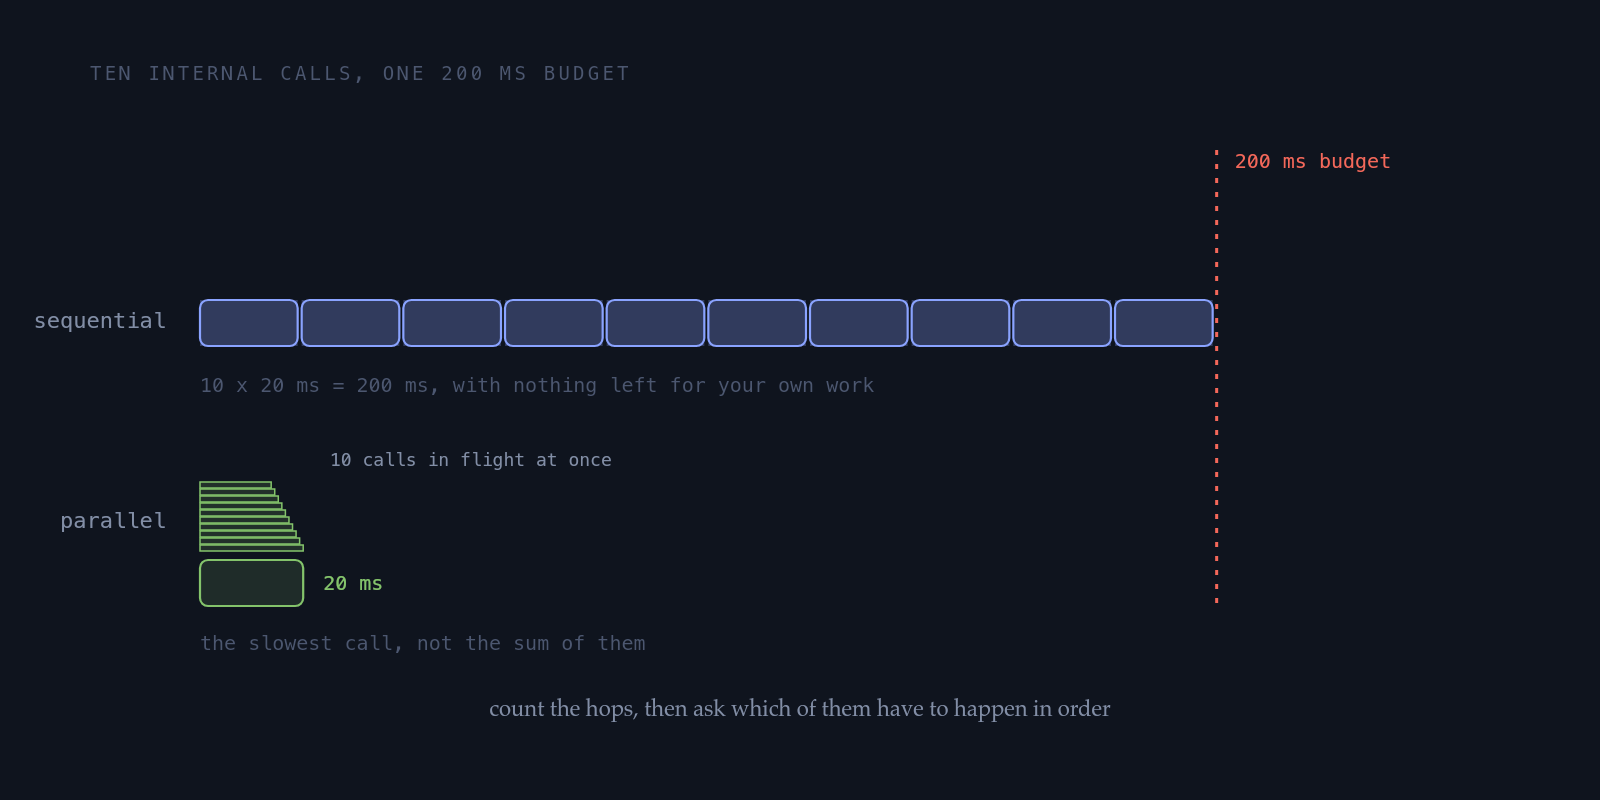
How many round trips a request may make is usually the largest single lever you have on latency.
Where data lives is the second one. A 150ms cross-region read cannot be hidden by anything except a local copy: a replica, a cache, or a CDN. All three introduce staleness, so "how close" and "how fresh" are one trade in two phrasings.
Whether a number is plausible is the third. An endpoint reporting 4ms while making two database queries and an HTTP call is either wrong or cached. The ladder is a lie detector for telemetry.
The one thing it will not tell you is what your users experience, because the ladder describes typical operations and users live in the tail. A p50 of 8ms and a p99 of 2 seconds is a normal, common, and terrible outcome, and that is the next lesson.
Key takeaways
- Memorize the ladder as ratios, not absolutes: each step is roughly two orders of magnitude, and the ratios outlive the hardware.
- Scale 1ns to 1 second when you need intuition. A cross-Atlantic round trip is five years.
- Two comparisons carry most arguments: a network hop costs about 5,000 memory reads, and a cache hit is about 1,000 times cheaper than a cross-region call.
- Sequential access beats random access at every layer, which is one fact behind batching, covering indexes, and sequential keys.
- Distance and memory latency do not improve with newer hardware. Disk throughput does.
- In a design review, count round trips and note which are sequential. That is usually the biggest lever you have.
Checkpoint · lesson 2 of 6
You can now:
- Recall the latency ladder from L1 cache to a cross-region round trip
- Reason in ratios, so the numbers stay useful as hardware improves
- Spot the two comparisons that decide most architecture arguments